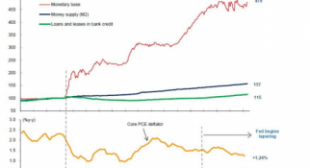
Why is the economy barely growing after seven years of zero rates and easy money? Why are wages and incomes sagging when stock and bond prices have gone through the roof? Why are stocks experiencing such extreme volatility when the Fed increased rates by a mere quarter of a percent?
It’s the policy, stupid. And here’s the chart that explains exactly what the policy is.
